What is a Data Pivot?
A Data Pivot is a quick way to manipulate data to analyse pattern. It enables grouping, slicing and rolling up of data through an intuitive user interface.
DataViews support multi-columns Data Pivot with rows grouping and many types of value aggregate and continue to support editing while the data is pivoted.
Configuring a Data Pivot
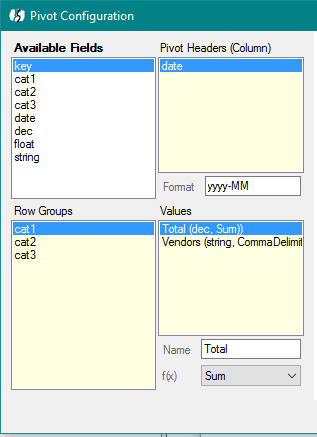
To configure a Data Pivot for a DataView open DataView Configuration Dialogue and click Configure a Pivot (click Edit Pivot if one is already defined). Drag and drop fields between the lists to setup rows groups, columns groups and values aggregate:
- Drop onto the Row Groups list to create grouping by row values
- Drop fields onto the Pivot Headers list to pivot the corresponding columns and create grouping by column values. You can specify a formatting string for each pivoted column
 TIPS TIPS
|
|
Use pivoted column format to group values together in series: for instance to truncate and group dates by month use the format 'yyyy-MM', the date values 04/07/1985, 10/07/1985 and 21/07/1985 will all be summarised under a column '1985-04'
|
- Drop fields onto the Values list to aggregate the data. You can to rename the aggregated field, and chose an aggregation method from the following:
- Count: the number of records aggregated into the field (include nulls)
- Min: the minimum value (number, date) or first word in alphabetical order (text) of all records
- Max: the maximum value (number, date) or last word in alphabetical order (text) of all records
- Sum: the sum of all numeric records that have numeric values
- Average: the sum of all numeric records that have numeric values divided by the total records count (include nulls)
- First: the first record of the list
- Last: the last record of the list
- Exists: return True if at least one record is found, False otherwise (a single null records returns True)
- CountDefined: the number of records aggregated into the field, null excluded
- CountDistinct: the number of distinct values aggregated into the field, null included once
- AverageDefined: the sum of all numeric records that have numeric values divided by the CountDefined
- SingleRow: the row value if a single record is in the aggregation, '<Multiple Rows>' otherwise
- SingleValue: the value if all record have the same value for the field, '<Multiple Values>' otherwise
- CommaDelimited: a concatenation of all the values separated with commas
- CommaDelimitedRank: a concatenation of all the unique values ordered by descending frequency of appearance, separated with commas
Editing data of a Pivoted DataView
Pivoted DataView still support data editing.
When you click a field to change its value, the Editing Dialogue displays the id of the record being edited, or the number of records, with an hyperlink that allows you to drill down and check what record(s) where aggregated under the clicked value.
If you try to edit a field for which there are no aggregated records, BimSens can switch to the default Create Action to create the associated record with the right row and column categories based on the Data Pivot configuration.
Example of Data Pivot
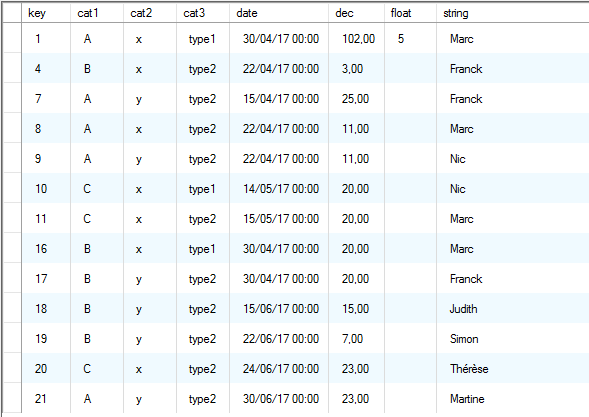
Example of row sales data
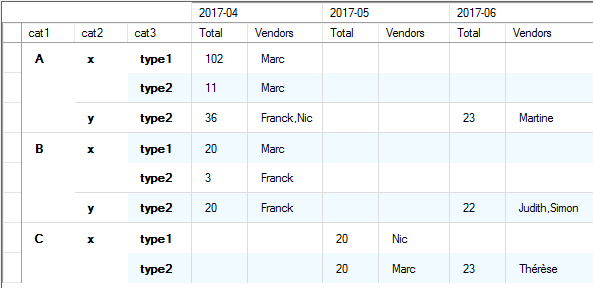
Corresponding pivoted data grouped by categories spread over month